Page Diagnostics for SharePoint – A Step-by-Step Guide

Vani R

Introduction
SharePoint is a robust platform for working together and managing content across organizations. Whether you’re an expert SharePoint user or just getting started, ensuring optimal performance and user experience is crucial. One tool that can help in this regard is Page Diagnostics for SharePoint.
How does Page Diagnostics for SharePoint work?
Page Diagnostics for SharePoint is a built-in tool that helps to identify and troubleshoot performance issues on SharePoint pages. It provides actionable insights and recommendations to improve page load times and user experience.
Why is Page Diagnostics Important?
In the digital work environment, users want quick access to information, and slow pages can annoy users and slow down work.
With Page Diagnostics, you can find and fix performance issues and ensure users can run your SharePoint sites smoothly.
Page Diagnostics for SharePoint: A Step-by-Step Guide
1. Install the Page Diagnostics for SharePoint tool as an extension for Microsoft Edge (Edge extension) or Chrome (Chrome extension), follow the permissions notice displayed, and manage your download permission to use the tool’s functionality.
(Note: You can also use the tool in Incognito or InPrivate mode.)
2. Navigate to the SharePoint site page you want to review.
3. Click on the extension’s toolbar button to load the tool.
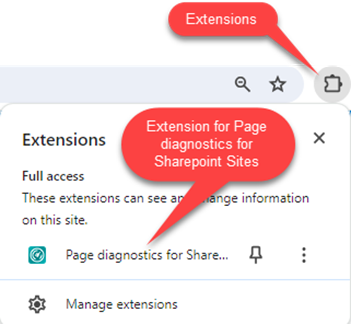
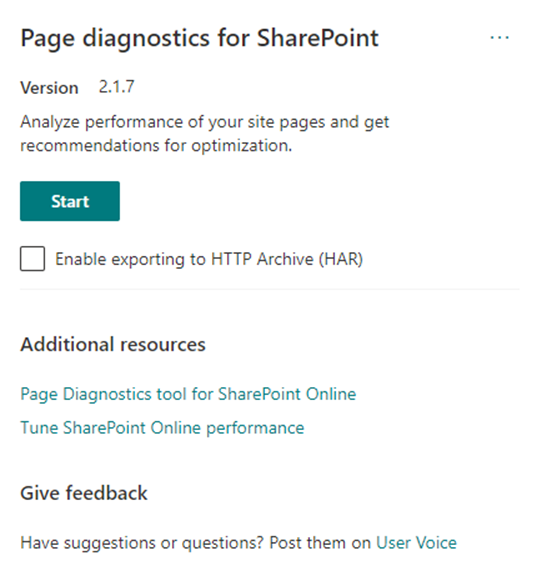
4. You’ll be presented with the following extension popup window; click on Start to collect data for evaluation
5. Once the diagnostic test is complete, Page Diagnostics will generate a report highlighting any performance issues detected on the page.
6. How to Review results:
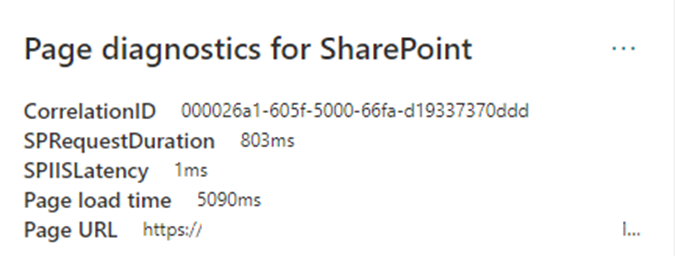
a. The result contains the below information, which helps to gather more diagnostic data for the specific page, such as:
- Time taken for SharePoint to process the page.
- Time in milliseconds taken for SharePoint Online to begin loading the page.
- The page measured the time from when it asked for something to when it showed the result in the browser.
- The web address of the current page.
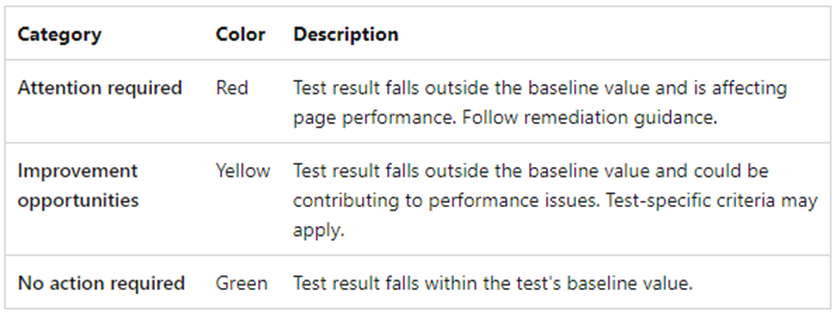
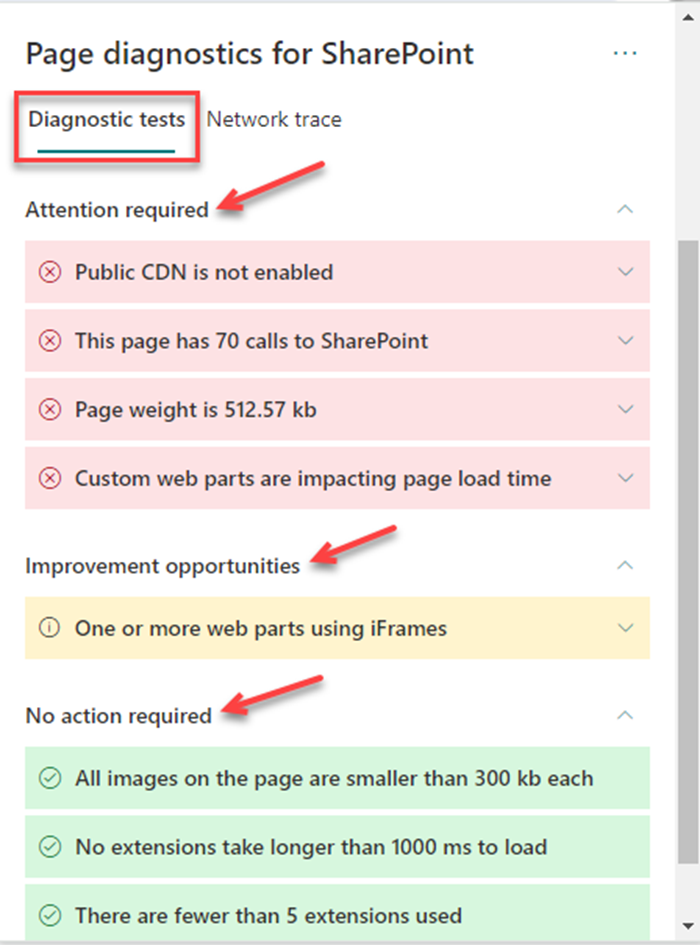
b. The “Diagnostic tests” tab displays the analysis results in three categories: “No action required,” “Improvement opportunities,” and “Attention required.” Each test result is represented by an item in one of these categories as described in the following table:
c. A “Network trace” tab details page build requests and responses. Each request and response is color-coded to indicate its impact on overall page performance using the following latency metrics:
- Green: < 500 ms
- Yellow: 500-1000 ms
- Red: > 1000 ms
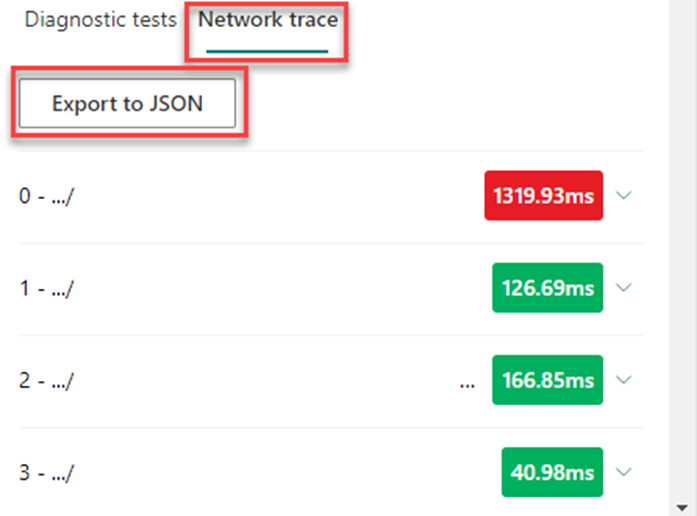
d. The “Export JSON” button on the “Network Trace” tab of a page diagnostics tool is significant because:
- It allows users to export the network trace data in JSON format.
- JSON export helps troubleshoot network-related issues on a web page. By exporting the network trace data, developers can delve deeper into the requests and responses between the browser and the server.
- The “Export JSON” button enhances the usability and effectiveness of the page diagnostics tool by providing users with a convenient way to access and analyze network trace data.
Importance of “Page Diagnostics Tool” in the Testing Process
A “page diagnostics tool” typically fits into the testing process to analyze and optimize web pages or applications’ performance, functionality, and overall health.
- Pre-Deployment Testing: Before deploying a web page or application, developers can use the page diagnostics tool to run various checks to ensure that the page meets performance standards, such as load time, page size, and resource utilization.
- Performance Testing: The diagnostics tool can identify bottlenecks and performance issues within the page or application during performance testing. It can provide insights into which page elements are slowing downloading times or causing delays in user interaction.
- Functionality Testing: The diagnostics tool may also include functionality testing capabilities, allowing testers to check if all page features and functionalities are working as expected. This could include checking form submissions, navigation, interactive elements, etc.
- Compatibility Testing: The tool can help test the page’s compatibility across different browsers, devices, and screen sizes. It can identify any rendering issues or discrepancies in functionality across various environments.
Staying Ahead with Page Diagnostics in SharePoint Administration
In the SharePoint administration and development scope, the Page Diagnostics Tool emerges as a cornerstone for optimizing performance and resolving issues effectively. By harnessing its capabilities, organizations can unlock the full potential of their SharePoint deployments, delivering a seamless user experience and driving productivity gains across the board. As SharePoint continues to evolve, leveraging tools like this becomes increasingly indispensable in maintaining peak performance and staying ahead of the curve.