Power BI for Office 365 provides an easy way for organizations to start doing self-service business intelligence today. Going by Gartner’s definition, Self-Service Business Intelligence is defined as “end users designing and deploying their own reports and analyses within an approved and supported architecture and tools portfolio.”
Power BI Self-Service Best Practices
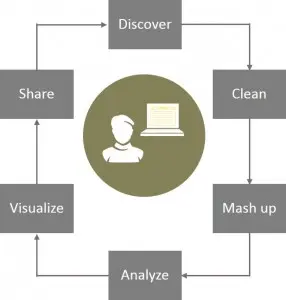
• Discover and fetch data
• Clean up and merge with other sources
• Analyze data to Visualize hidden insights
• Share the insights with others
Power BI brings together public and corporate catalog of data sets and BI models. It is being hailed as a way to search for data, a modern app and a Web-first experience. It’s loaded with rich interactive visualizations, collaboration capabilities, tools for IT to govern data and models, and a groundbreaking natural language experience for exploring insights. Power BI brings together many such key aspects of modernization of business intelligence while bringing data insights to a billion people.
At the same time, Office 365 is broadly adopted and growing – one in four of our enterprise customers now has Office 365. Power BI for Office 365 helps make business intelligence features part of Office. This unification of Power BI with Office 365 ensures that the BI tools are accessible, and easy to adopt.
Power BI for Office 365 – Features
- Quickly create collaborative BI sites – enable anyone to quickly create a collaborative BI site to share workbooks containing data and insights.
- Keep reports up to date with scheduled data refresh – reports that have been saved to the cloud can now connect back to on-premises data sources to refresh the data and stay up to date.
- Manage data queries for the team – share not only workbooks but also the data queries created in Power Query for Excel. Team members can now build and manage data queries for others to use when creating their own reports.
- Maintain a Data Catalog of searchable data – IT departments can now use the Data Catalog feature to make it easier for everyone to find and connect to corporate data by searching for it from within Excel.
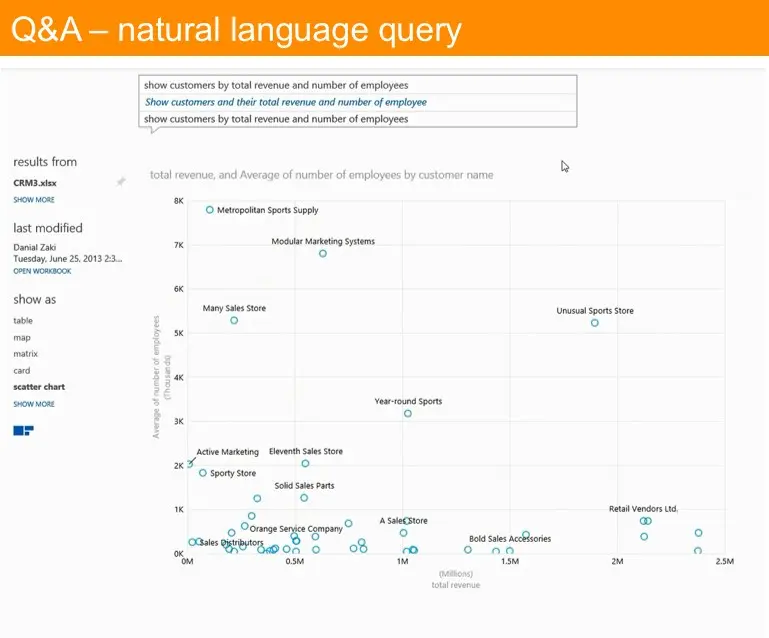
- Ask questions of your data in natural language – with the Q&A features people can type questions they have of the data in natural language and the system will interpret the question and present answers in the form of interactive visualizations.
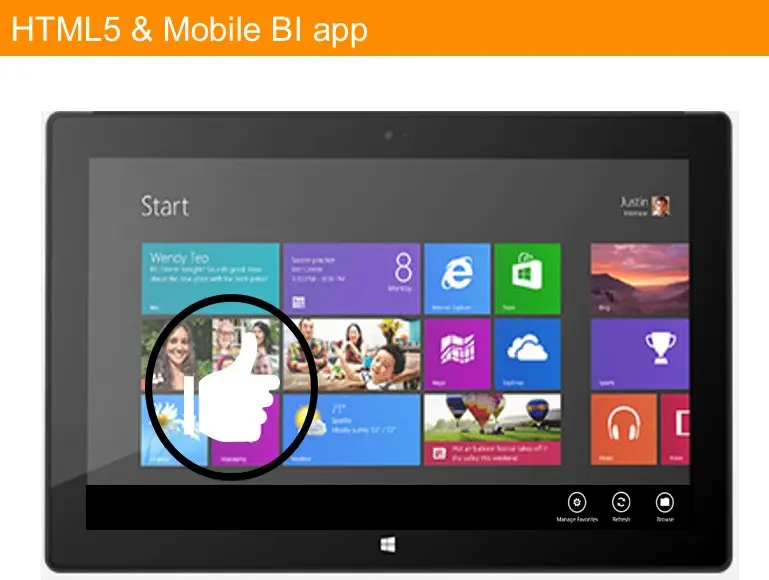
- Stay connected with mobile access to your reports – stay connected from anywhere with new HTML5 support and the Power BI mobile app.
Managed Self-Service BI with Excel 2013
Since Power BI is a cloud-based service, you will need Excel 2013 to create reports and models that can be consumed and refreshed with Power BI. Office 365 ProPlus or Microsoft Office Professional Plus 2013 include Excel 2013 that will give you access to Power Query, Power Pivot, Power View and Power Map to discover, analyze and visualize data. With Power BI you will be able to consume these reports created in Excel through your browser or mobile apps and to use cloud-based features such as natural language Q&A, data refresh, data catalog and Power BI sites.
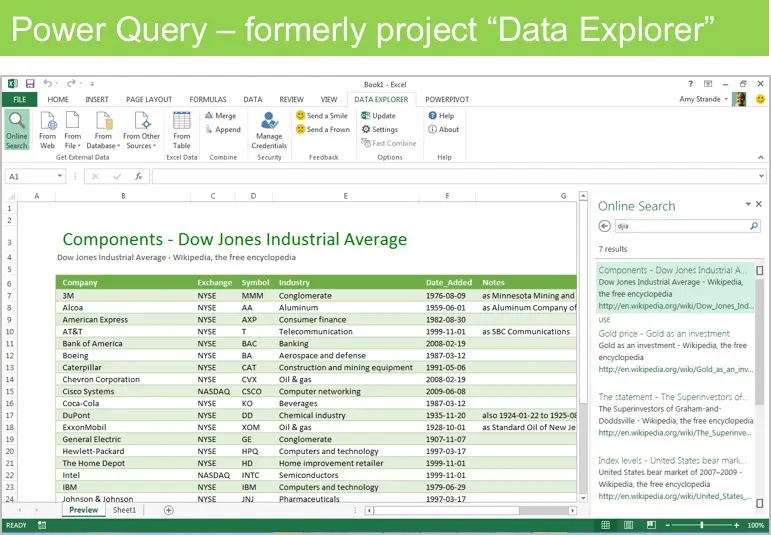
- Discover & Combine
- Search and access internal & external data
- Clean, transform, and shape data
- Merge and combine data from multiple sources
Analyze & Model
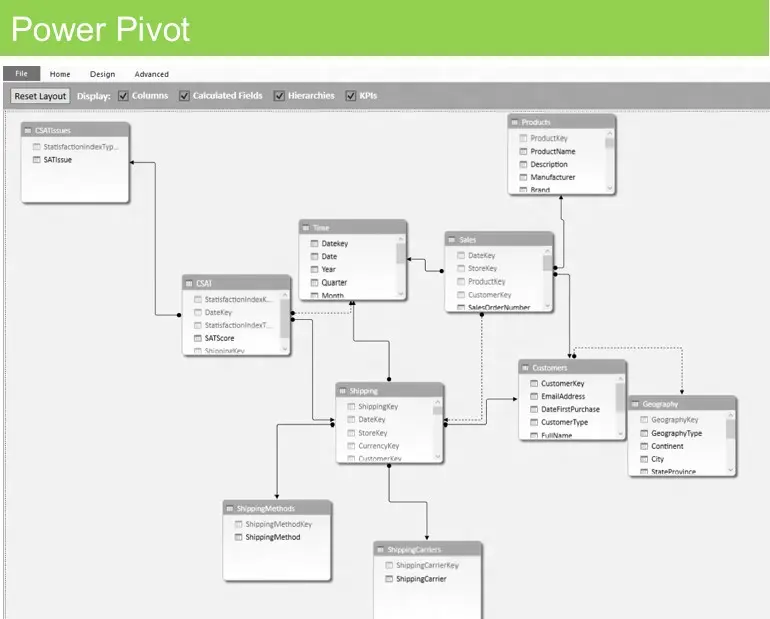
• Lightning fast analytics with in-memory technology
• Model relationships, custom measures, hierarchies, and KPI’s
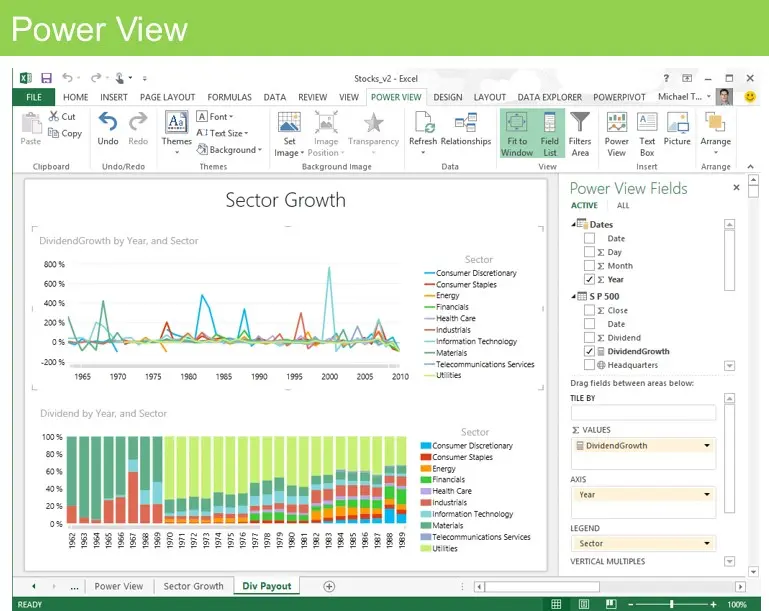
Visualize & Explore
• Bring your data to life with interactive visualization
• Explore data in new ways to uncover hidden insights

Collaborate and Stay Connected with Office 365
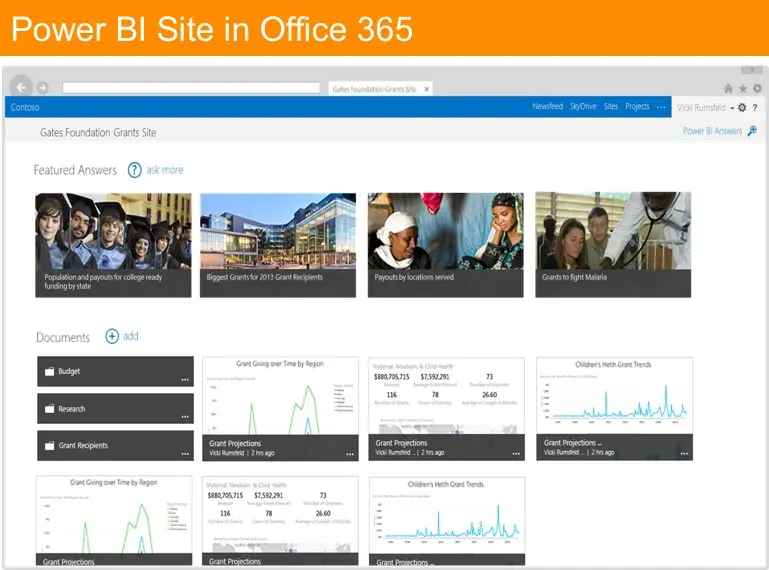
Share Data & Insights
• Easily setup powerful BI sites
• Share live reports with data refresh from on-prem sources
• Manage and share data sets and monitor usage
Ask Questions & Get Answers
• Ask questions in the natural language speech bubble
• Get back answers as the system generates data visualizations
Mobile Access
• View Power View reports on any device with HTML5 support
• Discover and explore all your favorite reports with the mobile BI app
